Sensing Sound
“Things are not the same as they used to be, because in the early days northern lights howled a great deal more than they do now.”
inuits, western Alaska
“Northern lights appear to have become less noisy since their occurrences have been more accurately recorded.”
Humboldt, Cosmos (1847)
Viewed from outer space, the Earth is a powerful planetary radio source. The dominant source of emission is a naturally occurring electromagnetic wave generated in the auroral zones. Auroral Kilometric Radiation (AKR) is closely tied to auroras, or more specifically to the beams of charged electrons that in interaction with atoms of oxygen and nitrogen result in auroral displays. Radio is both a human technology and a cosmic technology. AKR is the most powerful emission of terrestrial origin and is beamed into space, potentially making it detectable from other planets and galaxies, just as other extrasolar planets can potentially be detected through their radio emissions.
The human ear senses physical waves and cannot directly hear electromagnetic waves. However, radio emissions from Earth (along with other planets) at the lowest end of the radio spectrum including electromagnetic phenomena such as lightning and auroras can be translated into sound. For example by using a VLF (Very Low Frequency) receiver that captures radio waves vibrating at frequeincies overlapping the range of human hearing (20 Hz - 20kHz) and feeding them into a speaker. While the frequency range of AKR (50-500kHz) is outside of the audible range of humans imposing an artificial frequency shift enables humans to hear it.
Galaxy
What we do is we observe radio waves coming from the universe. The galaxy is giving off huge amounts of radio waves. That’s how it was discovered, because it was messing up people’s radio communication. It turned out it was the galaxy, and as a result we don’t use these frequencies any more. We use either really low frequencies protected by the ionosphere or we go to higher frequencies where the galaxy is not so bright. We know what the galaxy, or the radio sky, should look like. We have a map. So, we look at where radio waves are missing. We measure what we actually see and the difference is the absorption.
– Derek McKay, KAIRA (see Radar) Observer-in-Charge, in discussion with HH and AM, 2018, Tromsø
Posthuman perception
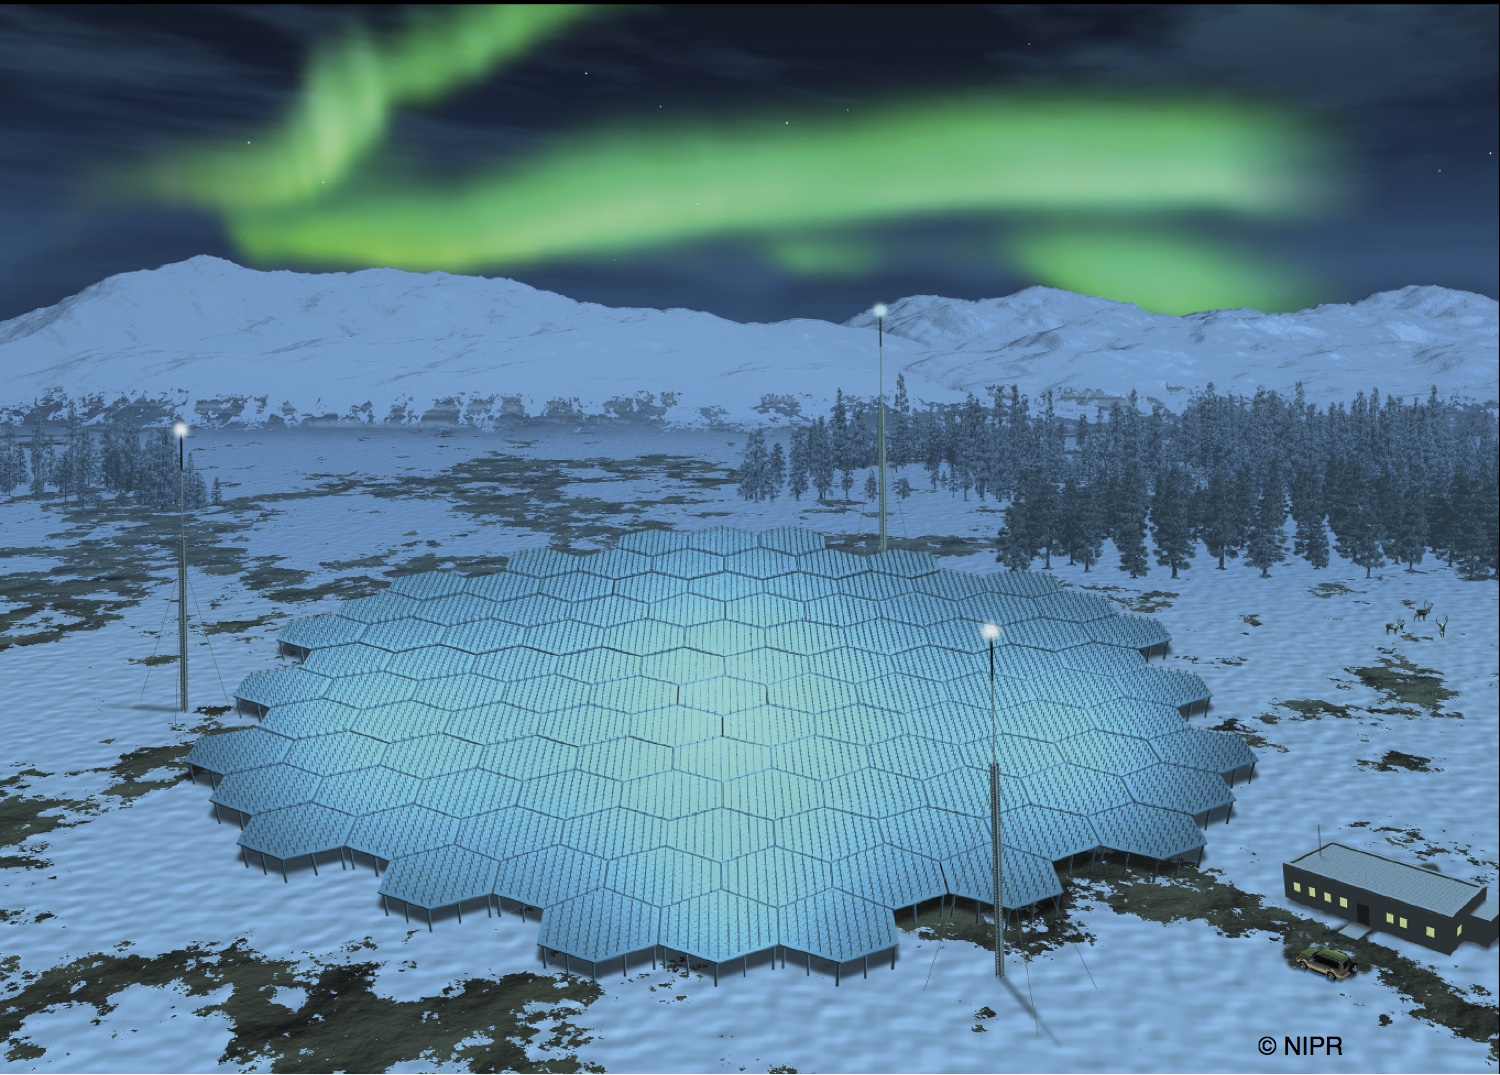
Imagine you have a camera where the sensor gets illuminated line by line. This is what EISCAT (see Radar) is doing now. It’s a bit like looking at the sky with binoculars, always in the same direction. Suddenly your field of view becomes green and then slowly it becomes black again. What can you conclude? Either you conclude that you were lucky the northern lights must have appeared in the spot where you were looking and then faded away, or you can conclude that the northern lights must have come from somewhere else and moved into your field of view and out of it. You can’t distinguish between those two. There’s space-time ambiguity. You don’t know. From experience you know, but you don’t know. We only do measurements in one little spot. Moreover, because radars are pretty expensive to run, we don’t run them all the time. So we miss a lot of interesting events. That’s why we want to build EISCAT 3D, a phase array with 10 000 antennas at each of three different sites. With EISCAT 3D the image will be illuminated in one go by virtual beams, without moving tons of hardware. Everything will be digitised at a much higher time resolution, and we can change the experiment when we want to. We can have instruments on a satellite, and while you sit with your computer on your sofa at home you can reprogram it and change what you get. Instruments become cheaper, smaller and more available, so you can put more of them out there, so the data amount starts to grow. It becomes a Big data thing. You need a supercomputer to process it, especially if you want to do it in realtime. If you record that much data you also need to be able to correlate and analyse it. So we’re looking into artificial intelligence in image recognition.
– Thomas Ulich, EISCAT facility leader in discussion with HH and AM, 2018, Sodankylä
Although machinic vision occurs through data and datafication, and can essentially be understood as post-optical, machinic vision and Big data are – similar to the microscope or telescope – often portrayed as enabling enhanced vision through the rendering visible of existing but invisible processes and effects. As media scholar Orit Halpern has pointed out, vision encompasses its permutations: visualisation, visuality and visibilities. Machinic vision should therefore not be understood in isolation but as a technical condition still relying on historically contextualised material-semiotic discourses and practices – such as ideologies and structural inequalities embedded in optical metaphors – for making “the inhuman, that which is beyond or outside sensory recognition, relatable to the human being” (Note 1). In extension, as Big data offers ways of seeing with nonhuman life, it also becomes co-constitutive of vision, provoking transformations in how humans know and perceive, and thereby enables novel tactics of governance and power. In her critique against algorithmic governmentality legal scholar Antoinette Rouvroy has pointed out that processes of datafication operate through what is capturable and calculable – from behaviour rather than subjectivity, and from what is effectuated, while unrealised dreams remain ignored (Note 2). By framing governance as an ongoing and technical process of responsiveness without seeking to understand causality this computational turn bypasses human interpretation and evaluation (processes of meaning-making, transcription or representation, institutionalization, convention and symbolization) accepting the world (with its social, economic and environmental issues) as it is.
On the other hand, drawing on Walter Benjamin’s notion of the optical unconscious, enabled by photography and visual technologies such as slow motion and close-ups, that brought “to light entirely new structures of matter” and in so doing changed and affected the material reality of the worlds it offered access to, as well as Astrida Neimanis’ “ethics of unknowability”, visual and cultural theorist Daniela Agostinho proposes a speculative reimagining of datafied vision “conceived differently, perhaps not only as an instrument of sensorial enhancement, calculation and control, but as generator of new possibilities, or at least a site where this openness to the unknown can be articulated” (Note 3). Alternatively, are there other non datafied posthuman visions of the atmosphere to be envisioned?
Note 1: O. Halpern, Beautiful Data: A History of Vision and Reason since 1945, Durham & London, Duke University Press, 2015.
Note 2: A. Rouvroy, "The end(s) of critique: Data behaviourism versus due process,” in Privacy, Due Process and the Computational Turn. Philosophers of Law Meet Philosophers of Technology, eds. Mireille Hildebrandt and Katja de Vries (New York: Routledge, 2013), 143–168.
Note 3: D. Agostinho, “The Optical Unconscious of Big Data : Datafication of vision and care for unknown futures.” In Big Data & Society. 2019; Vol 6, Nr. 1: 1-10.
A keogram (derived from ‘Keoeeit’ the Inuit-word for aurora borealis) a time-versus-latitude plot creating a summary image of individual all-sky images captured during night.
Atlas of Auroral Forms

Following the exceptional displays of aurora that succeeded the long period of low solar activity — referred to as the Maunder Minimum (ca 1620-1716) — scientists tried to categorize auroras according to their structures in an attempt to constitute auroral phenomena as an object of rational inquiry. Agreeing on the fleeting and ever changing appearance of aurora was, however, difficult. The first Auroral Atlas was completed over two centuries later in 1930 by Norwegian mathematician and astrophysicist Carl Størmer after he — together with Ole Andres Krogness, Norwegian physicist and one of Kristian Birkeland’s assistants (see Hi(s)story) — developed a faster and more sensitive camera that made it possible to image aurorae (see Posthuman perspective). Størmer took hundreds of photographs of auroras, which allowed him to sort the phenomena into 15 distinct categories. His work was presented in a 15-page atlas with auroral pictures individually produced in a photography laboratory, then glued into the book and covered with translucent silk paper for protection. The atlas draws upon both scientific and artistic sensibility and comprises astronomical, mathematical and photographic expertise.
...
Homogeneous Arcs (HA) and Bands (HB)
Auroral Arcs (RA) and Bands (RB) with Ray Structures
Feeble Glows (G):
Auroral Rays (R), Draperies (D) and Coronas (C)
Coronal Aurorae (C)
Spiral Structures
Feeble homogeneous arcs at great altitude (HA*)
Pulsating Arcs (PA) and Pulsating Surfaces (PS)
Cloud-like aurorae, Irregular, Diffuse Patches and Surfaces (DS)
Flaming Aurorae (F)
Red patches
Low-latitude Red Arcs
(Størmer, C., Photographic Atlas of Auroral Forms and Scheme for Visual Observations of Aurorae, 1st ed., A. W. Bröggers Boktrykkeri, Oslo, 1930/1950)